
📊 Comparative Report: India’s Service Exports vs Saudi Arabia’s Oil Exports
1. Overview
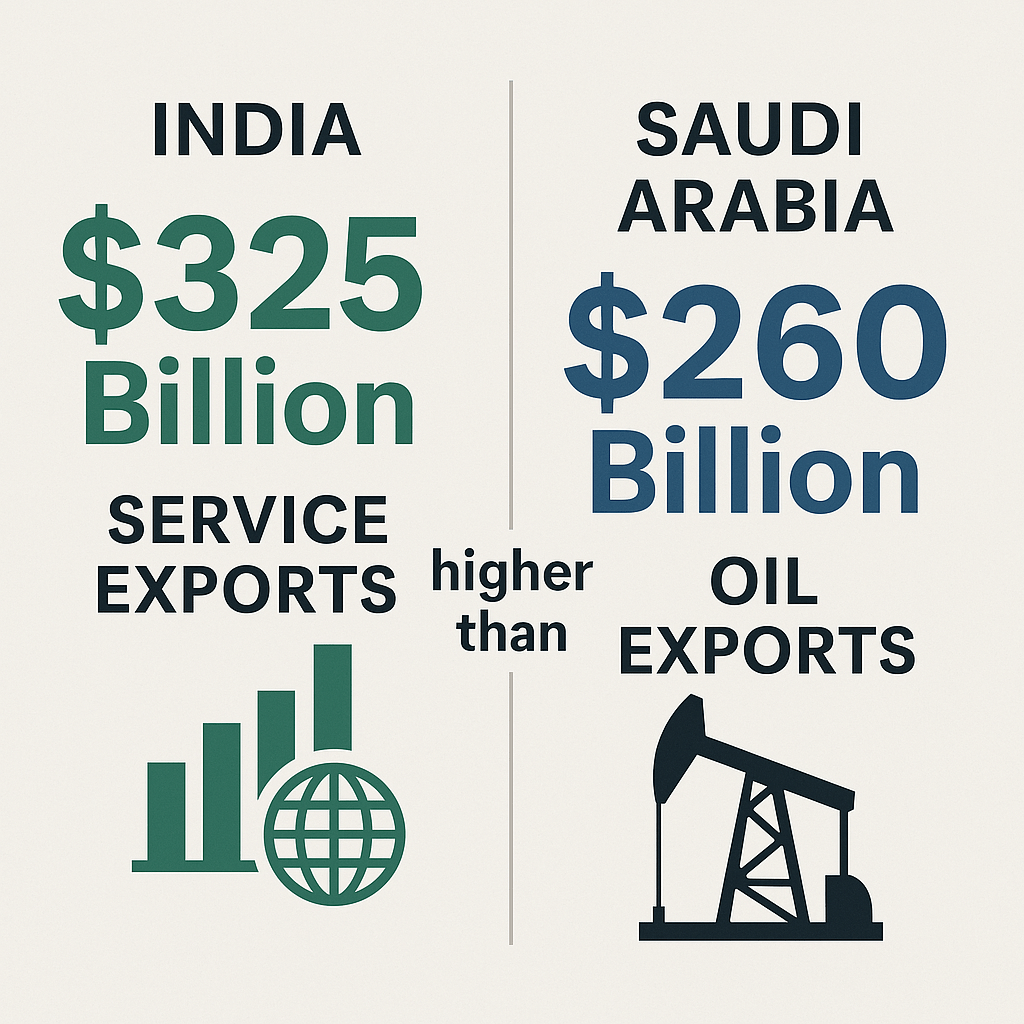
In a major shift in global trade dynamics, India’s service exports have surged to approximately $325 billion (FY2024), surpassing Saudi Arabia’s total oil exports which stand at around $260 billion. This comparison is symbolic of changing economic strengths, showcasing India’s rise as a knowledge and technology-driven economy and highlighting Saudi Arabia’s dependence on hydrocarbon resources.
2. India’s Service Export Growth
📈 Key Figures:
- FY2023–24 (Est.): $325 billion (source: Ministry of Commerce, India)
- Growth Rate: ~10–12% YoY
- Share of GDP: ~10%
- Global Rank: Among the top 7 service exporters globally
🧠 Major Contributors:
| Sector | Approx. Contribution |
|---|---|
| IT and ITeS | $180–200 billion |
| Business & Professional Services | $35–40 billion |
| Financial Services | $20–25 billion |
| Travel & Tourism | $15–18 billion |
| Transportation & Logistics | $10–15 billion |
| R&D and Engineering Services | $8–10 billion |
🛠 Key Drivers:
- Global demand for IT outsourcing and digital transformation
- Rise of Software-as-a-Service (SaaS) firms and start-up ecosystem
- Competitive advantage in English-speaking, skilled labor
- Growth of fintech, consulting, and analytics sectors
3. Saudi Arabia’s Oil Exports
🛢 Key Figures:
- 2023 Total Oil Exports: ~$260 billion (source: OPEC, Saudi Aramco, IMF)
- Volume: ~7 million barrels per day (net exports)
- Dependence on Oil Revenue: >70% of total export revenue
📉 Challenges:
- Oil price volatility: Brent crude averaged ~$82/barrel in 2023, compared to >$100/barrel in 2022.
- OPEC+ Production Cuts: Reduced overall volumes
- Global Energy Transition: Shift toward renewables and EVs
- Domestic Reforms: Vision 2030 seeks diversification, reducing over-reliance on oil
4. Economic & Geopolitical Significance
| Factor | India | Saudi Arabia |
|---|---|---|
| Economic Model | Service-led, diversified | Oil-based, in transition |
| Long-term Growth | Sustainable with high innovation potential | Vulnerable to global energy shifts |
| Geopolitical Leverage | Soft power through IT & diplomacy | Hard power through energy exports |
| Strategic Shift | Digital economy, AI, cloud, fintech | Tourism, infrastructure (Neom, Vision 2030) |
5. Implications & Outlook
🌏 For Global Economy:
- Shift in global trade balance toward digital and knowledge economies
- Growing south-south trade led by service economies (India, ASEAN, Africa)
- Services less prone to climate or geopolitical shocks than commodities
🇮🇳 For India:
- Services now outperforming goods in export growth
- Strengthens INR stability and foreign exchange reserves
- Opportunity to lead in AI, cybersecurity, biotech, etc.
🇸🇦 For Saudi Arabia:
- Increased urgency for economic diversification
- Strategic investments in non-oil sectors, e.g., tourism, sports, AI
- Oil still key for short-term cash flows and fiscal health
6. Conclusion
India’s $325 billion service export achievement marks a strategic inflection point — a transition from a back-office outsourcing hub to a global powerhouse in high-value services. In contrast, while Saudi Arabia’s oil remains a potent global commodity, the world’s pivot toward digitization and sustainability gives countries like India a unique opportunity to lead the future economy.
7. Visual Comparison (Summary Table)
| Metric | India (Services) | Saudi Arabia (Oil) |
|---|---|---|
| 2023–24 Export Value | $325 billion | $260 billion |
| Growth Trend | Upward | Volatile/Declining |
| Diversification | High | Low (but improving) |
| Long-term Stability | High | Medium to Low |
| Strategic Advantage | Tech, Talent | Energy, Geography |
Curated by Gurdeep Singh, Senior Editor


Leave a comment