
The Stochastic Indicator is a momentum oscillator that measures the level of the closing price of a security relative to the high-low range over a specific period of time. It is widely used in technical analysis for predicting price movements in the financial markets.
Key Components
- Formula:
- The Stochastic Oscillator is calculated using the following formula:
- %K = (Current Close – Lowest Low) / (Highest High – Lowest Low) * 100
- %D = 3-period SMA of %K
- Where:
- Current Close = the most recent closing price.
- Lowest Low = the lowest price over the chosen period.
- Highest High = the highest price over the chosen period.
- The Stochastic Oscillator is calculated using the following formula:
- Parameters:
- The basic parameters for the Stochastic Indicator are usually set for 14 periods, but they can be adjusted based on the trader’s preference and market conditions.
- %K: The main line that tracks the momentum.
- %D: The signal line, which is a smoothed version of %K.
Interpretation
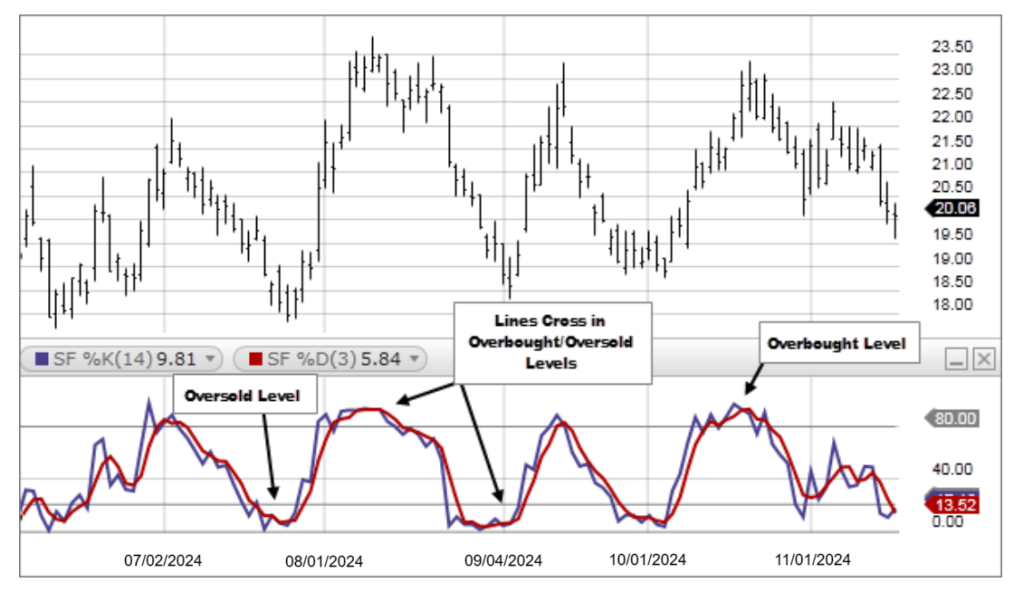
- Overbought and Oversold Conditions:
- Typically, a reading above 80 indicates that a security is overbought, while a reading below 20 suggests it is oversold.
- Divergence:
- A divergence between the Stochastic Indictor and the price can indicate potential reversal signals. For instance, if prices are making new highs but the Stochastic is failing to do so, this could suggest a weakness in momentum.
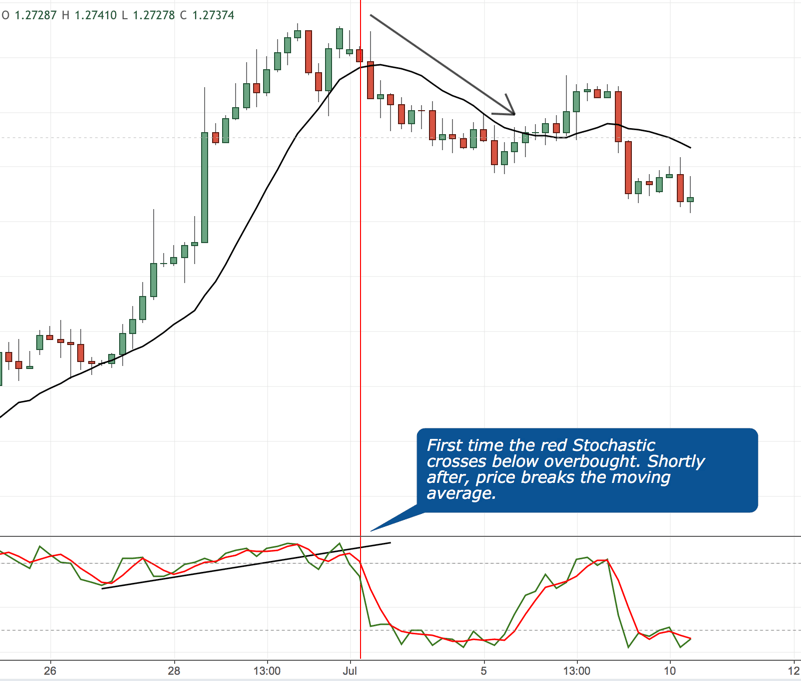
- Crossovers:
- Traders often look for crossovers between the %K and %D lines as potential buy or sell signals. When %K crosses above %D, it may be considered a buy signal, and vice versa for a sell signal.
Visualization
The Stochastic Indicator is usually represented as two lines (%K and %D) on a scale from 0 to 100. These lines oscillate between the overbought and oversold levels, providing visual clarity on momentum shifts.
Use in Trading Strategies
- Trend Following:
- Traders may use the Stochastic Indicator in conjunction with other trend indicators to confirm trends and align trades with the market direction.
- Reversal Trading:
- The indicator is also used for identifying potential reversal points when the market is in overbought or oversold territory.
- Combining with Other Indicators:
- It is often beneficial to combine the Stochastic Indicator with other technical indicators (like Moving Averages, RSI, etc.) for more robust trading signals.
Conclusion
The Stochastic Indicator is a powerful tool for traders, offering insights into momentum and potential price reversals. By understanding its calculation, interpretation, and integration into trading strategies, traders can enhance their decision-making process and improve their trading outcomes.


Leave a comment