
What is MACD?
The MACD (Moving Average Convergence Divergence) is a popular technical analysis indicator used in financial markets to identify potential buy and sell signals. It helps traders and investors analyze the momentum, direction, and strength of an asset’s price by using two moving averages.
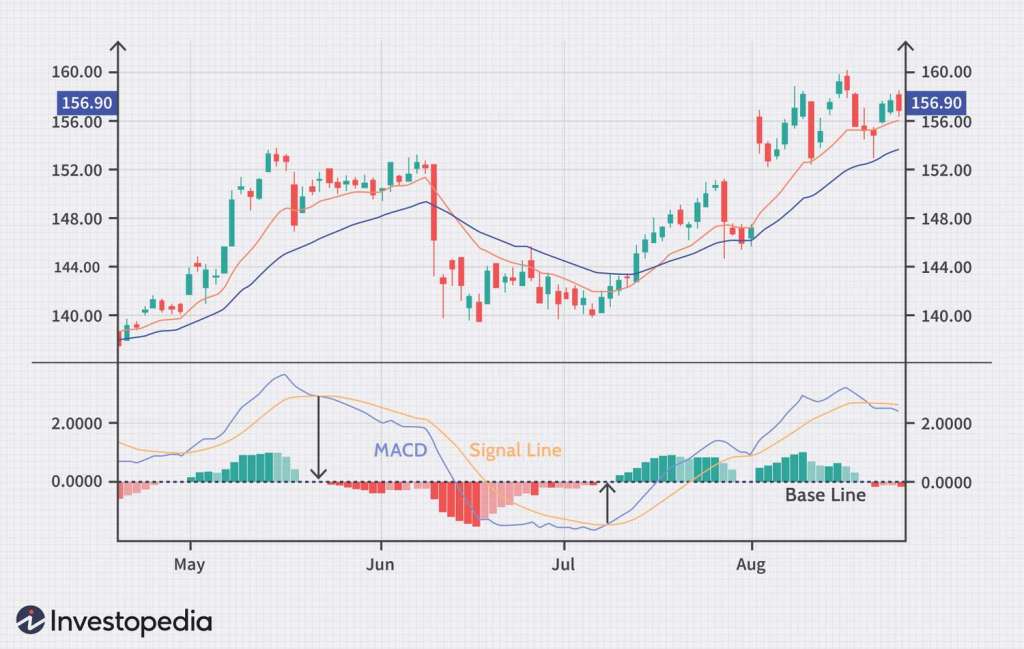
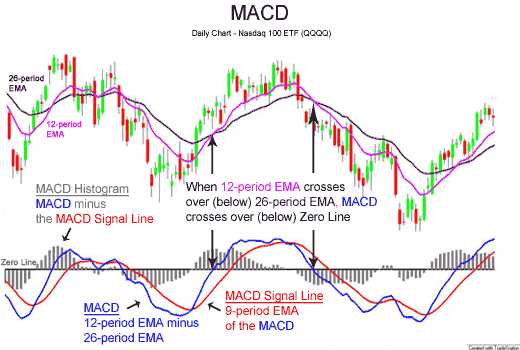
Components of MACD
- MACD Line: The difference between the 12-day Exponential Moving Average (EMA) and the 26-day EMA. This line indicates the momentum of the asset.
[ \text{MACD Line} = \text{EMA}(12) – \text{EMA}(26) ]
- Signal Line: A 9-day EMA of the MACD line. This line is used to generate trading signals.
[ \text{Signal Line} = \text{EMA}(9) ]
- Histogram: The graphical representation of the difference between the MACD line and the signal line. It shows the strength of the momentum; when the histogram is above zero, the MACD line is above the signal line, indicating a bullish trend, and when it’s below zero, it indicates a bearish trend.
[ \text{Histogram} = \text{MACD Line} – \text{Signal Line} ]
How to Read MACD
- Crossovers:
- Bullish Crossover: When the MACD line crosses above the signal line, it may signal a buying opportunity.
- Bearish Crossover: When the MACD line crosses below the signal line, it may indicate a selling opportunity.
- Divergence:
- Bullish Divergence: Occurs when the price makes a lower low, but the MACD makes a higher low. This may indicate a potential reversal to the upside.
- Bearish Divergence: Happens when the price makes a higher high, but the MACD shows a lower high. This may signal a potential reversal to the downside.
- Overbought/Oversold Conditions:
- When the MACD is significantly above zero, it can indicate an overbought condition, while a value significantly below zero may indicate an oversold condition.
Advantages of MACD
- Versatility: Works well in various market conditions—trending or ranging.
- Simple to Use: Easy to understand and apply, even for beginners.
- Provides Both Divergence and Momentum Signals: Allows traders to make informed decisions based on multiple factors.
Limitations of MACD
- Lagging Indicator: Since it relies on past price movements, it may not always predict future trends accurately.
- False Signals: Can produce false signals in choppy or sideways markets, leading to potential losses.
- Requires Complementary Analysis: Should be used in conjunction with other indicators or analysis techniques for best results.
Conclusion
The MACD indicator is a powerful tool for traders seeking to analyze market momentum and make informed trading decisions. By understanding its components, how to interpret them, and their advantages and limitations, traders can enhance their technical analysis skills and improve their trading strategies.
Hashtags
#MACD #TechnicalAnalysis #TradingSignals #MomentumTrading #FinancialMarkets #Investing #TradingStrategy #Bullish #Bearish #Overbought #Oversold #MarketAnalysis #ExponentialMovingAverage #TechnicalIndicators #InvestmentTips


Leave a comment