
Introduction
Bollinger Bands are a popular technical analysis tool used in financial markets to identify potential price movements, volatility, and overbought or oversold conditions. Created by John Bollinger in the 1980s, this indicator can be applied to various asset classes, including stocks, commodities, and currencies.
Components of Bollinger Bands
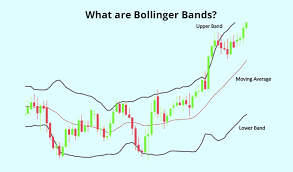
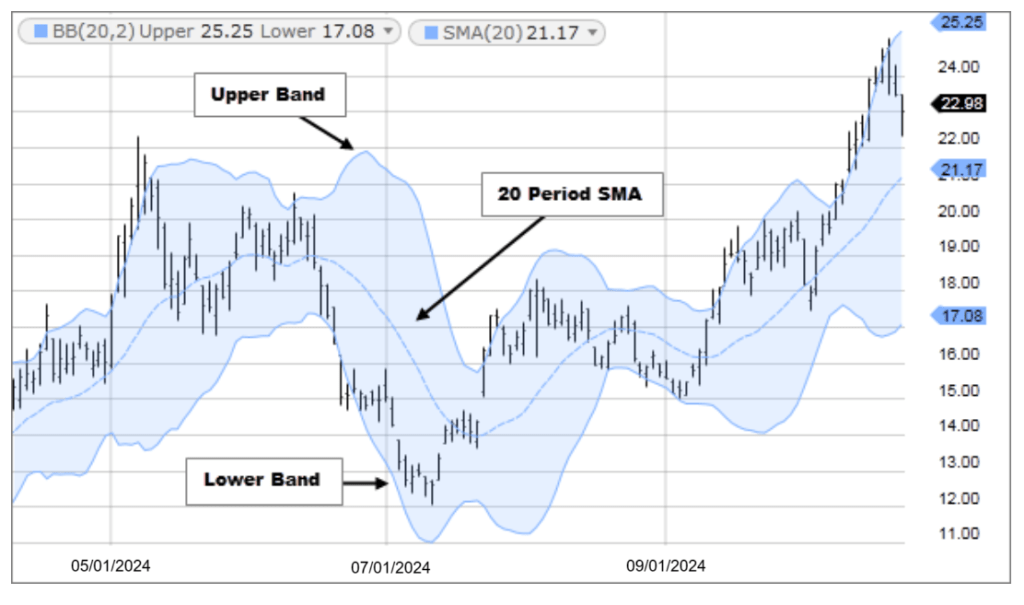
Bollinger Bands consist of three lines:
- Middle Band (SMA): The middle band is a simple moving average (SMA) usually set to 20 periods. It represents the average price of the asset over a specific period.
- Upper Band: The upper band is calculated by adding two times the standard deviation (SD) of the asset’s price to the middle band. The formula is:
[
\text{Upper Band} = \text{SMA} + (2 \times \text{SD})
] - Lower Band: The lower band is calculated by subtracting two times the standard deviation from the middle band. The formula is:
[
\text{Lower Band} = \text{SMA} – (2 \times \text{SD})
]
How to Calculate Bollinger Bands
- Calculate the Simple Moving Average (SMA) for the chosen period.
- Calculate the standard deviation (SD) of the asset price over the same period.
- Determine the Upper and Lower Bands using the formulas provided above.
Interpretation
- Price Proximity: Price touching the upper band may suggest that the asset is overbought, while price touching the lower band may suggest it is oversold.
- Volatility: The distance between the bands indicates market volatility. Wider bands signify higher volatility, while narrower bands suggest lower volatility.
- Breakouts: When the price breaks through the upper or lower band, it may indicate a potential continuation or reversal of the trend, depending on accompanying volume and other market signals.
Trading Strategies
- Bollinger Band Squeeze: This occurs when the bands come close together, indicating low volatility. Traders often look for potential breakout opportunities in either direction once the bands expand again.
- Overbought and Oversold Conditions: Traders may consider entering a position when the price reaches the upper or lower band, anticipating a reversion to the mean (the middle band).
- Trend Following: If the price consistently moves above the middle band, it may indicate a bullish trend, whereas consistent movement below the middle band may signal a bearish trend.
Limitations
- Bollinger Bands are lagging indicators; they may not predict price movements in real-time.
- False signals can occur during volatile market conditions.
- They should not be used in isolation; combining Bollinger Bands with other indicators can improve decision-making.
Conclusion
Bollinger Bands are a versatile and widely-used tool in technical analysis. Understanding how to calculate and interpret these bands can enhance trading strategies and assist in identifying potential market trends. However, they should be used in conjunction with other analysis methods for more accurate trading decisions.


Leave a comment